Quick look at Python 3's Starred Expressions
A starred expression is when you add a “*” in front of a variable. It can also be called “Extended Iterable Unpacking”
This has the effect of acting as a “catch all” for lists.
The idea behind this is to replace this “messy” line:
first, rest = li[0], li[1:]
It can be replaced with:
first, *rest = li
One interesting use-case is capturing both the start and the end of a list, and the list without those indexes:
li                  = [1, 2, 3, 4, 5]
start, *middle, end = li
print(start)   # outputs 1
print(middle)  # outputs [2, 3, 4]
print(end)     # outputs 5
Comparison between Starred Expressions and Indexing
Now lets have a look at the differences in the speed of each approach - Index vs starred expression.
Below is a graph showing the time it takes to complete 1000000 loops of each of the following snippets:
Normal Indexing
start=lst[0]
middle=lst[1:-1]
end=lst[-1]
Stared Expressions
start, *middle, end = lst
Where lst is a list of integers from 1 -> n.
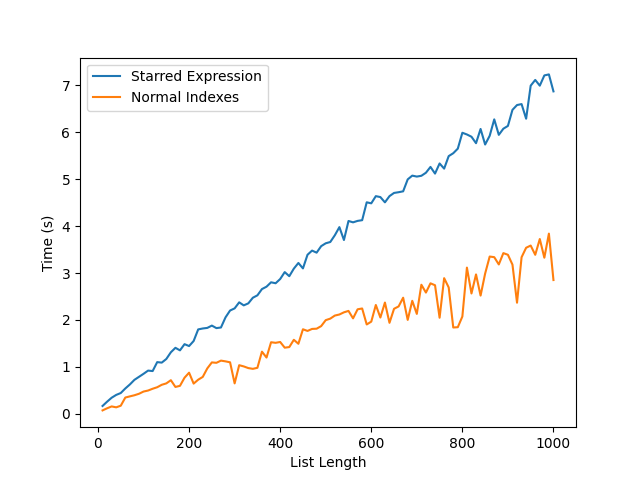
As you can see the Starred expression is a fair bit slower than using normal indexing. This is because the Starred expression does the following:
- Collect all items for mandatory targets before the starred one
- Collect all remaining items from the iterable in a list
- Pop items for mandatory targets after the starred one from the list
- Push the single items and the resized list on the stack
It is also important to note that while I have only talked about lists in this post, the expression can be used on any iterable, for example Sets where the index approach will not work:
m = set((1,2,3,4))[1:-1]
Traceback (most recent call last):
  File "<input>", line 1, in <module>
    m = set((1,2,3,4))[1:-1]
TypeError: 'set' object is not subscriptable
s, *m, e = set((1, 2, 3, 4))
The code to generate the graph is below:
import timeit
import numpy as np

from matplotlib import pyplot as plt

index_code   = "start=lst[0];middle=lst[1:-1];end=lst[-1]"
starred_code = "start, *middle, end = lst"
rst_index_x  = []
rst_index_y  = []
for x in range(10, 1010, 10):
    rst_index_y.append(x)
    rst_index_x.append(
        np.mean(
            timeit.repeat(repeat=100,
                          stmt=index_code,
                          setup=f"lst=list({range(1,x)})")))
rst_y = []
rst_x = []
for x in range(10, 1010, 10):
    rst_y.append(x)
    rst_x.append(
        np.mean(
            timeit.repeat(repeat=100,
                          stmt=starred_code,
                          setup=f"lst=list({range(1, x)})")))
plt.plot(rst_y, rst_x, label="Starred Expression")
plt.plot(rst_index_y, rst_index_x, label="Normal Indexes")
plt.xlabel("List Length")
plt.ylabel("Time (s)")
plt.plot(rst_y, rst_x, label="Normal Indexes")
plt.legend(loc="upper left")
plt.show()
Note that exact timings are dependent on the machine running the code, and should only be used as a way to compare two approaches, your mileage may vary.
All in all Starred expressions are a interesting tool, they can make code look cleaner, and can be very powerful, they are however slightly slower than indexing and my not be best used in time critical applications when you can use indexing.